The numbers show it too. A Gartner research concludes that the cost of poor data quality in organizations averages up to $12.9 million annually. Another study by MIT Sloan Management Review puts it even more bluntly: poor data quality costs organizations between 15% to 25% of revenue.
In this blog, we’ll uncover five hidden costs of poor data quality that are really costing your business.
Table of Contents
-
- Defining “Poor Data Quality.”
- Why does it happen: The Real Causes Nobody Talks About
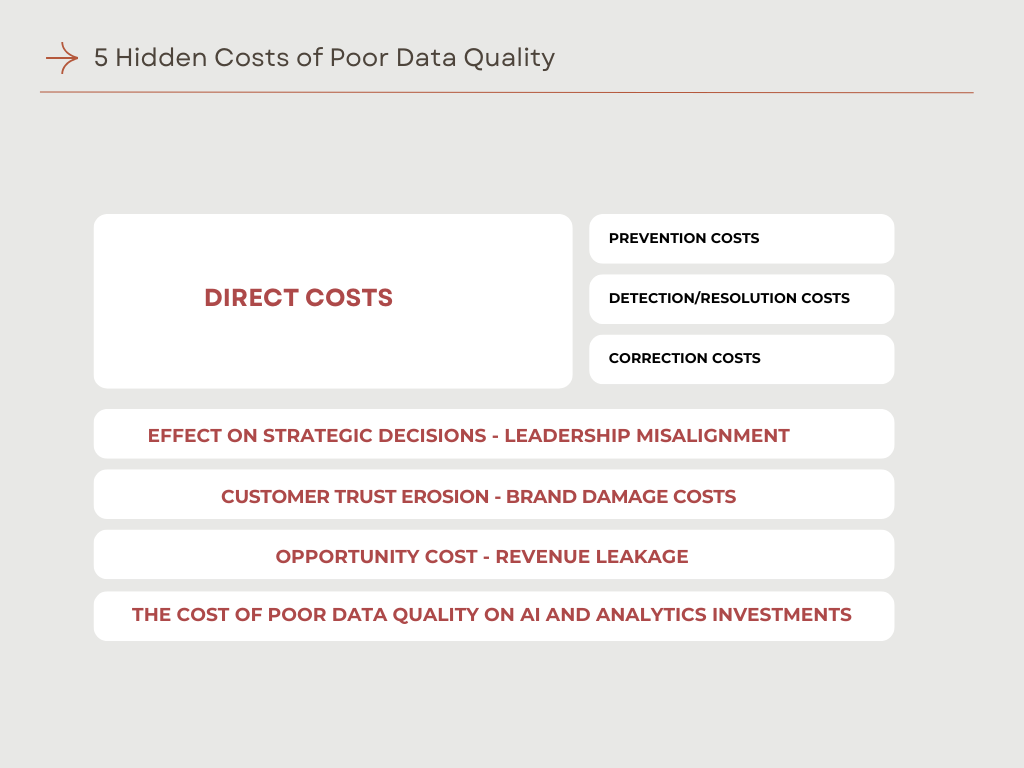
- 5 Hidden Costs of Poor Data Quality
- Direct Financial Drains: Visible but Often Underestimated
- Effect on Strategic Decisions and Leadership Misalignment
- Customer Trust Erosion and Brand Damage Costs
- Opportunity Cost and Revenue Leakage
- The Cost of Poor Data Quality on AI and Analytics Investments
- Conclusion
- Defining “Poor Data Quality.”
Defining “Poor Data Quality”
Before we dive into the hidden costs, we need to understand “poor data quality”. Poor data quality manifests across four different yet critical aspects:
-
-
- Accuracy: Data that isn’t correct and comprehensive. Missing fields, outdated information, and factual errors all fall under this category.
- Consistency: Data points not matching across all your systems. Even if it’s correct, but more than two years old, it might as well be wrong. Imagine marketing shows $500K in the fourth quarter, but the sales reports show the same as $650K; you have a consistency issue.
- Conformity: Data not following the standards and formats of your systems. Inaccurate codes and undefined text fields at data entry break automation workflow and compromise the analytics.
- Integrity: The relationships among data are not legitimate and not properly maintained. These unlinked records create duplicate entries, wasted storage, and confused analytics.
-
Why does it happen: The Real Causes Nobody Talks About
-
-
- Business data decays at approx. 30% per year. People change jobs, companies relocate, phone numbers change, and contact details become obsolete.
- While upgrading systems or merging platforms, data migration isn’t looked at as a high-stakes game. Data fields are mapped incorrectly, and thousands of records get corrupted.
- Even if good quality data exists, cross-functional teams can’t access it, as different departments maintain separate data warehouses with different access controls.
- Lack of data governance discipline breeds no clear ownership, no regular audits of existing data records, and no one monitoring the data quality metrics.
-
5 Hidden Costs of Poor Data Quality
The most expensive problems in the business aren’t visible. But they drain the resources, tarnish customer relationships, and sabotage the opportunities every single day.
Direct Financial Drains: Visible but Often Underestimated
Approximately 181 zettabytes of data were created, captured, copied, and consumed in 2025, averaging up to approximately 400 million terabytes every day. And it’s projected to be tripled by the end of this decade. Still, the majority of organizations underestimate the costs of poor data quality, which they can actually measure. It falls into three categories:
-
-
- Prevention Costs: This is the never-ending money pit, as it includes everything an organization spends to avoid data quality depletion. It includes training staff on data-entry standards, improving monitoring tools and dashboards, and purchasing data quality software.
- Detection/Resolution Costs: As per the data quality management principle proposed by George Labovitz and Yu Sang Chang, this second phase costs 10 times more than the prevention cost. Once prevention fails, the team spends 50-60% of their time detecting data inconsistencies, errors, and gaps.
- Correction Costs: The most expensive phase, costing up to 100 times more than preventing data quality decay. It is the cost of taking no accountability and ownership of the data that runs the organization.
-
Effect on Strategic Decisions and Leadership Misalignment
Imagine a scenario: A software company is planning to launch its product. The finance team is showing the first-year revenue projection at $4M. The marketing team claims the budget to be $5.6M, while the sales team reports it to be $6.8M. Which number is correct?
The outcome: The launch is likely to be delayed by 4-6 weeks because the different teams need to reconcile their data and rebuild the financial models. By the time they actually launch the product, the delay cost due to the competitor or the first-mover advantage can cost them up to $2M in market share.
Potentially, it gets even more damaging when CXOs lose trust in their own data. It all results in long, frequent meetings to reconcile numbers, asking for manual reports, requesting “the real numbers”, and making stalled approvals.
Customer Trust Erosion and Brand Damage Costs
The United States dominates the data infrastructure sector with 59.2% of global data centers. Still, it loses approximately. $611B per year in poorly targeted mailings and brand value depletion.
One journal published at the University of Southern Denmark concludes that around 60% of customers abandon a brand after just one bad data experience. The reason seems minor, such as wrong names, incorrect bills, duplicate outreach, or mis-personalized offers.
Real World Impact: A B2B SaaS company with 500 enterprise accounts and $250K average customer lifetime value. Even a 5% churn rate increase from data quality issues means losing 25 customers annually. That’s $6.25M in lost revenue before accounting for acquisition costs to replace them.
These poor data quality incidents seem small but are noticed by the customers. It creates friction and erodes the brand’s trust over time.
Opportunity Cost and Revenue Leakage
The false sense of “you’re not missing anything”, whereas you’re missing out on a lot of aspects, results in perhaps the most insidious cost of poor data quality.
Real World Scenario: Imagine the marketing team plans to launch a targeted campaign, based on the data provided by the sales team. But the data shows:
-
-
- 30% of contact records are outdated, i.e., bounce emails.
-
- 15% of companies listed have already purchased, i.e., wasted spend on existing customers.
-
- 25% are duplicate accounts under different names, i.e., multiple teams targeting the same prospect
-
The outcome: The $250K campaign generates a 0.8% conversion rate, where it should be between 4-5%. Not only was the campaign budget wasted, but the revenue opportunity was missed due to poor data quality.
The Cost of Poor Data Quality on AI and Analytics Investments
Your board is asking about your AI strategies. And to keep up with the trends among peers, there will likely be a rush to implement AI models. But the decisions made by the AI models are as good as their training data. Thus, misleading predictions and stalled projects are likely the outcomes.
CIO’s research shows that:
-
-
- Over 80% AI/ML projects fail due to “potential lack of data accuracy”.
-
- Models being trained on inconsistent data produce unreliable “hallucinating” insights that lead decisions astray.
-
- 60% of teams’ time goes to cleaning data instead of building models
-
The Hidden Cost: For every $1 invested in AI technology, companies waste $0.50-$0.80 on failed implementations due to poor data quality.
Conclusion
If you’ve read this far, you’re likely calculating the combined cost of poor data quality for your organization.
The Bad News: It costs between 15-25% of annual revenue for companies. And every quarter you delay, it gets compounded.
The Good News: If you plan and start investing in comprehensive data quality programs, you’ll get the results:
-
-
- 30-50% reduction in operational costs
-
- 15-25% faster decision-making
-
- 2-3x better AI/analytics project success rates
-
Thus, your next steps should be:
-
-
- Quantify your exposure: Take your annual revenue. Multiply by 0.02 (2%). That’s your conservative data quality cost estimate. For e.g., $50M revenue means $1M annual data quality cost.
- Audit critical systems: Identify your highest-risk data quality gaps.
- Establish data governance: Define ownership and accountability.
- Implement systematic solutions: Don’t just clean once, build ongoing quality processes.
-
Now the question isn’t whether you can afford to fix your poor data quality problems. But the question is: Can you afford not to?
At Datafortune, we’ve helped organizations across healthcare, finance, insurance, and retail transform data quality from liability to competitive advantage. Our team helps in quantifying the hidden costs and builds a roadmap to turn your data into a strategic asset.
Schedule a data quality assessment with our team today! Contact us