This blog will dive into how context graphs work and why they’re transforming enterprise AI from impressive prototypes into business-critical tools.
Table of Contents
- What Is a Context Graph?
- What Used to Happen (Before Context Graphs)
- How a Context Graph Works
- Context Graphs vs Vector Databases vs Knowledge Graphs vs Ontologies
- Why Context Graphs Matter in AI Systems
- Business Impact: What Leaders Should Know About It
- Conclusion
What Is a Context Graph?
A context graph is a structured framework that maps relationships between information across multiple dimensions (contexts), such as time, entities, events, behaviors, and intent. It captures how contexts interconnect and how those connections shift based on constraints and real-world conditions surrounding the information.
Think of it as the difference between a phone directory and a social network. A directory lists names and numbers, which are facts in isolation. A social network maps who knows whom, how they’re connected, and when they interact. Context graphs bring this network-thinking approach to enterprise data.
What Used to Happen (Before Context Graphs)
Consider an enterprise software team building an internal knowledge assistant. A developer asks a simple question: “Show me the authentication bug fix team lead suggested from last sprint.” The AI system springs into action, scanning thousands of documents. Moments later, it returns 47 results. Every single mention of “authentication,” “bug,” “fix,” and “team lead” is scattered across every sprint.
The developer spends the next 20 minutes manually sifting through irrelevant documentation from sprints six months ago, abandoned pull requests, and unrelated security discussions. The AI delivered data, but it fundamentally misunderstood what the developer actually needed.
Why? Traditional databases store facts in isolation. Vector databases could find semantically similar content, but couldn’t understand that “last sprint” creates temporal context. The system had information but lacked contextual intelligence and context engineering to make it meaningful.
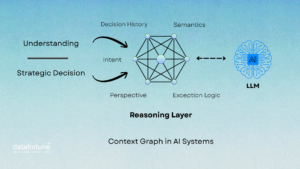
How a Context Graph Works
A context graph uses two core building blocks: nodes and edges. Nodes represent entities, the actual things in your system. Edges represent relationships between those entities. But context graphs go further by enriching these connections with contextual metadata. Let’s return to our developer with a context graph in place.
The same question: “Show me the authentication bug fix from last sprint”, now produces dramatically different results.
Nodes represent entities: the team lead, the authentication bug fix suggestion, the code repository, the sprint number, and the fix documentation. Now the context graph traces a web of relationships, Edges:
- Time context: “Last sprint” maps to Sprint 23, which ran from November 4-15.
- Entity context: “Authentication” connects to the OAuth service module, the login component, and the security team’s domain.
- Event context: “Bug fix” links directly to Jira ticket #2847, pull request #1203, and deployment to staging.
- Relationship context: The team lead suggested the fix, the developer reviewed the code, and QA validated the changes.
The result? One contextually relevant answer from the internal knowledge assistant AI system. One precise document. The exact fix with related code changes, team discussion threads, and deployment notes. Not 47 loosely related results.
Context Graphs vs Vector Databases vs Knowledge Graphs vs Ontologies
When enterprises evaluate AI systems, they encounter several approaches that sound similar but serve distinct purposes. These four approaches fall in the similar sounding criteria.
- Context Graphs: It has context layers that add meaning, such as Temporal (when did this happen), relational (who was involved), causal (why did it happen), and consequential (what was the impact).
- Vector Databases: They convert content into numerical representations and excel at finding semantically similar items. However, they can’t explain why things are similar or how context changes that similarity.
- Knowledge Graphs: They map universal domain relationships and business rules. The limitation is that they’re largely static. They capture what’s generally true but don’t adapt to temporal changes, individual behaviors, or situational variance.
- Ontologies: They define categories and hierarchical classifications. While valuable for organizing information, they miss behavioral patterns, temporal dynamics, and situational context.
Why Context Graphs Matter in AI Systems
Let’s understand with the very same developer, and its internal knowledge assistant AI system. Six months after deploying their context graph-powered knowledge assistant, our enterprise software team saw transformative results
- Developer productivity transformed dramatically. What used to take 30 minutes of frustrated searching now takes 90 seconds. AI-powered assistants became genuinely useful rather than marginally helpful innovations. Developers stopped treating the knowledge system as a last resort and started relying on it as their primary resource.
- Knowledge retention improved across the organization. When senior developers leave, their expertise doesn’t disappear. The context graph has captured not just what they knew but how that knowledge connected to projects, decisions, and implementation patterns.
- Perhaps most importantly, the system gets smarter with every interaction. Each query, each new code commit, and each resolved bug enriches the context graph. This creates a compound value that traditional systems can’t match.
Context graphs are emerging as essential AI infrastructure. They’re the layer that transforms AI from systems that process information into systems that understand what that information actually means.
Business Impact: What Leaders Should Know About It
For technical leaders evaluating context graphs, the question is what context graphs enable at scale and how it translates to business outcomes.
- For CTOs and Engineering Leaders: Context graphs accelerate developer onboarding by mapping tribal knowledge that typically lives only in senior engineers’ heads. Technical debt becomes more manageable when AI systems understand code relationships across temporal dimensions. Most critically, AI ROI dramatically improves as the gap between impressive demos and production value bridges.
- For Data and Analytics Leaders: Context graphs reveal that relationships between data points often matter more than the data itself. Each new data point doesn’t just add information. It enriches the contextual web, making the entire system more intelligent, and the value compounds over time.
- For Business Leaders: Competitive advantage emerges from AI systems that genuinely understand your business context. Operational efficiency improves when employees find answers in seconds rather than hours. Risk mitigation becomes more robust. AI systems that understand context make fewer embarrassing mistakes because they grasp not just what to do but when, why, and for whom.
Conclusion
The developer who once spent 30 minutes searching through 47 irrelevant results now receives exactly what they need in seconds. But this isn’t about search optimization. It’s context. The one factor that brings the difference between AI systems that impress in demos and those that deliver sustained business value.
Context graphs capture what databases miss: that the same information means different things at different times, to different people, in different situations. They understand that “last sprint” creates temporal boundaries, that team relationships influence which information matters, and that causal chains connect seemingly isolated events into meaningful patterns.